Empowered by Data: Raising Awareness on Racial Health Disparities in Minnesota
By Ma Xiong, MPH – Vice President, Data Strategy & Analytics
April is a month dedicated to raising awareness of racial and ethnic health disparities and taking action to close the gaps. Minnesota continues to be ranked as the best state in the nation for health care1. However, it is also one of the states with some of the largest health disparities between the White population and communities of color2.
MN Community Measurement (MNCM) has been a leader in collecting and analyzing data on Race, Ethnicity, Preferred Language, and Country of Origin (RELC) since 2010. By publicly reporting results on quality measures stratified by RELC, it shines a light on health disparities, equipping community partners with the insights needed to take meaningful action.
Spotlight on Disparities in Diabetes and Vascular Health
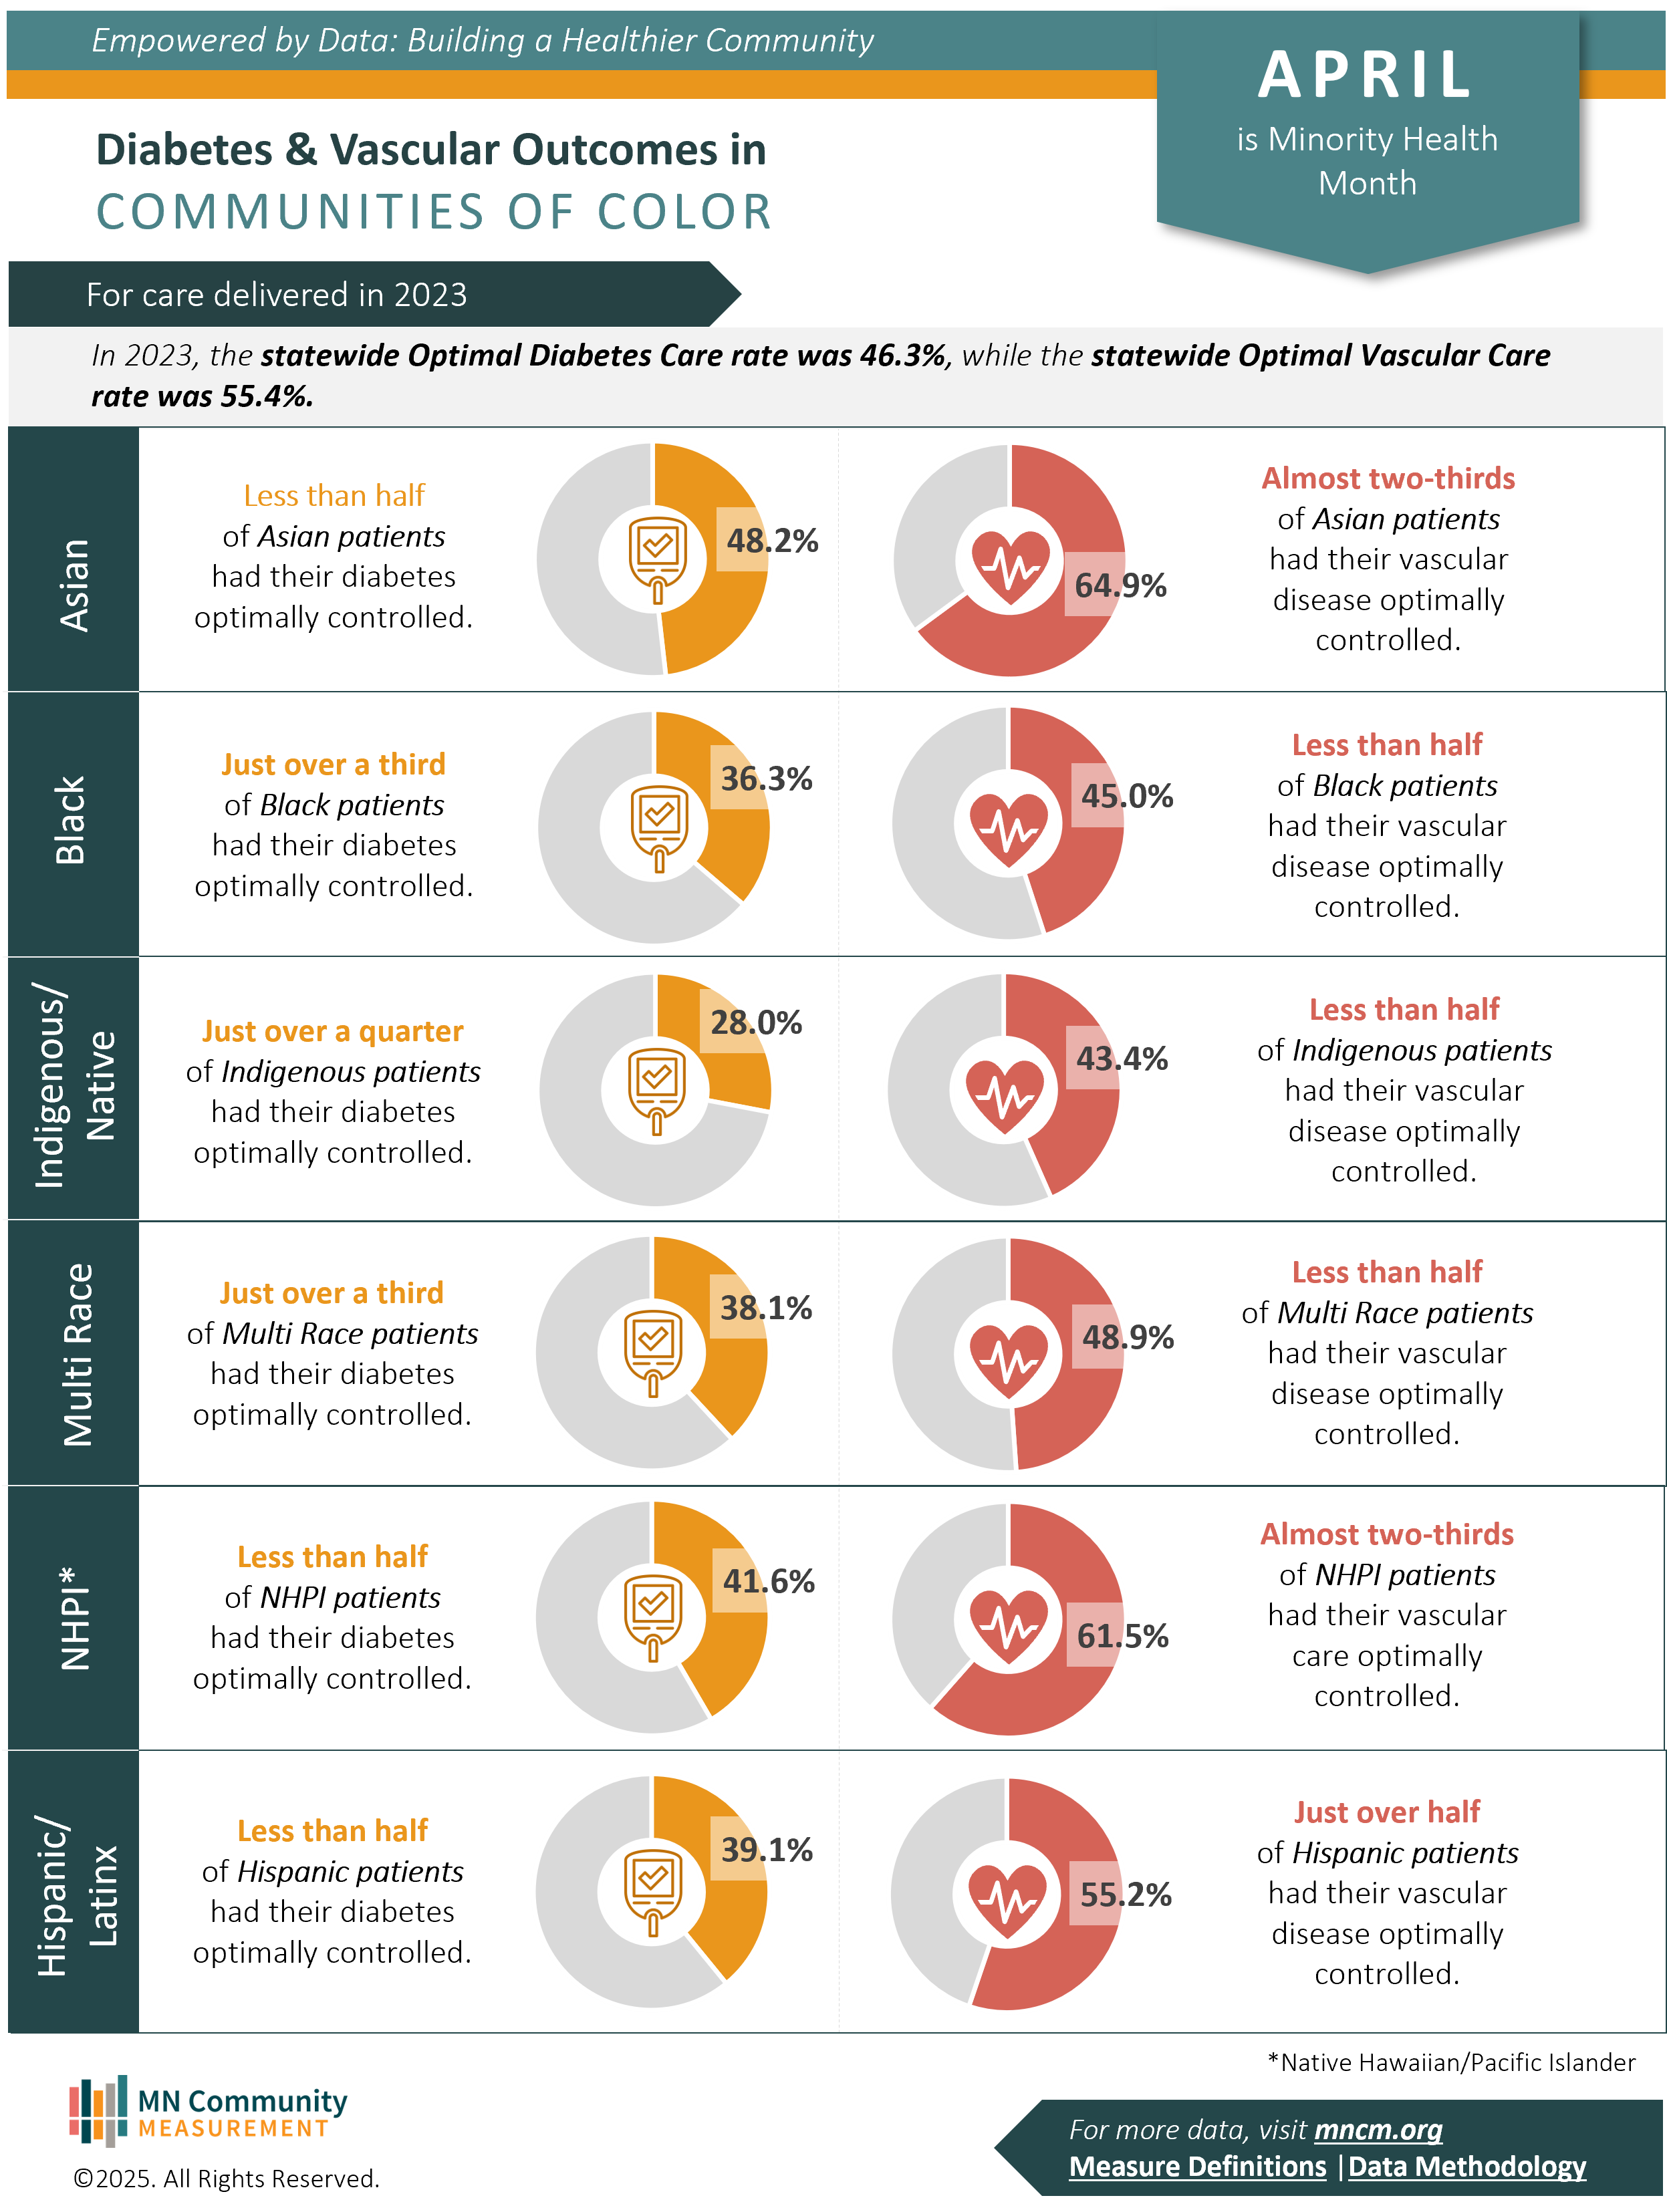
This April, MNCM is focusing on health disparities in two key areas: Optimal Diabetes Care and Optimal Vascular Care based on data from 2023.
Optimal Diabetes Care is achieved when five health goals are met:
- Controlled blood pressure (<140/90 mmHg)
- Statin use as recommended to lower bad cholesterol
- Blood sugar under control (A1c <8%)
- Tobacco-free status
- Use of aspirin as recommended
Optimal Vascular Care includes four of these same goals, excluding blood sugar control.
MNCM’s data reveals significant disparities in achieving optimal diabetes and vascular care:
- Black, Indigenous, Multi-race, Native Hawaiian/Pacific Islander, and Hispanic/Latinx patients had significantly lower rates of having their diabetes optimally controlled compared to the overall statewide average of 46.3%.
- While Asian patients overall exceeded the statewide average, MNCM’s analysis showed that Hmong and Karen language speakers had much lower rates, highlighting the importance of looking beyond broad racial categories.
- Black, Indigenous, and Multi-race patients had lower rates of having their vascular disease optimally controlled compared to the overall statewide average of 55.4%.
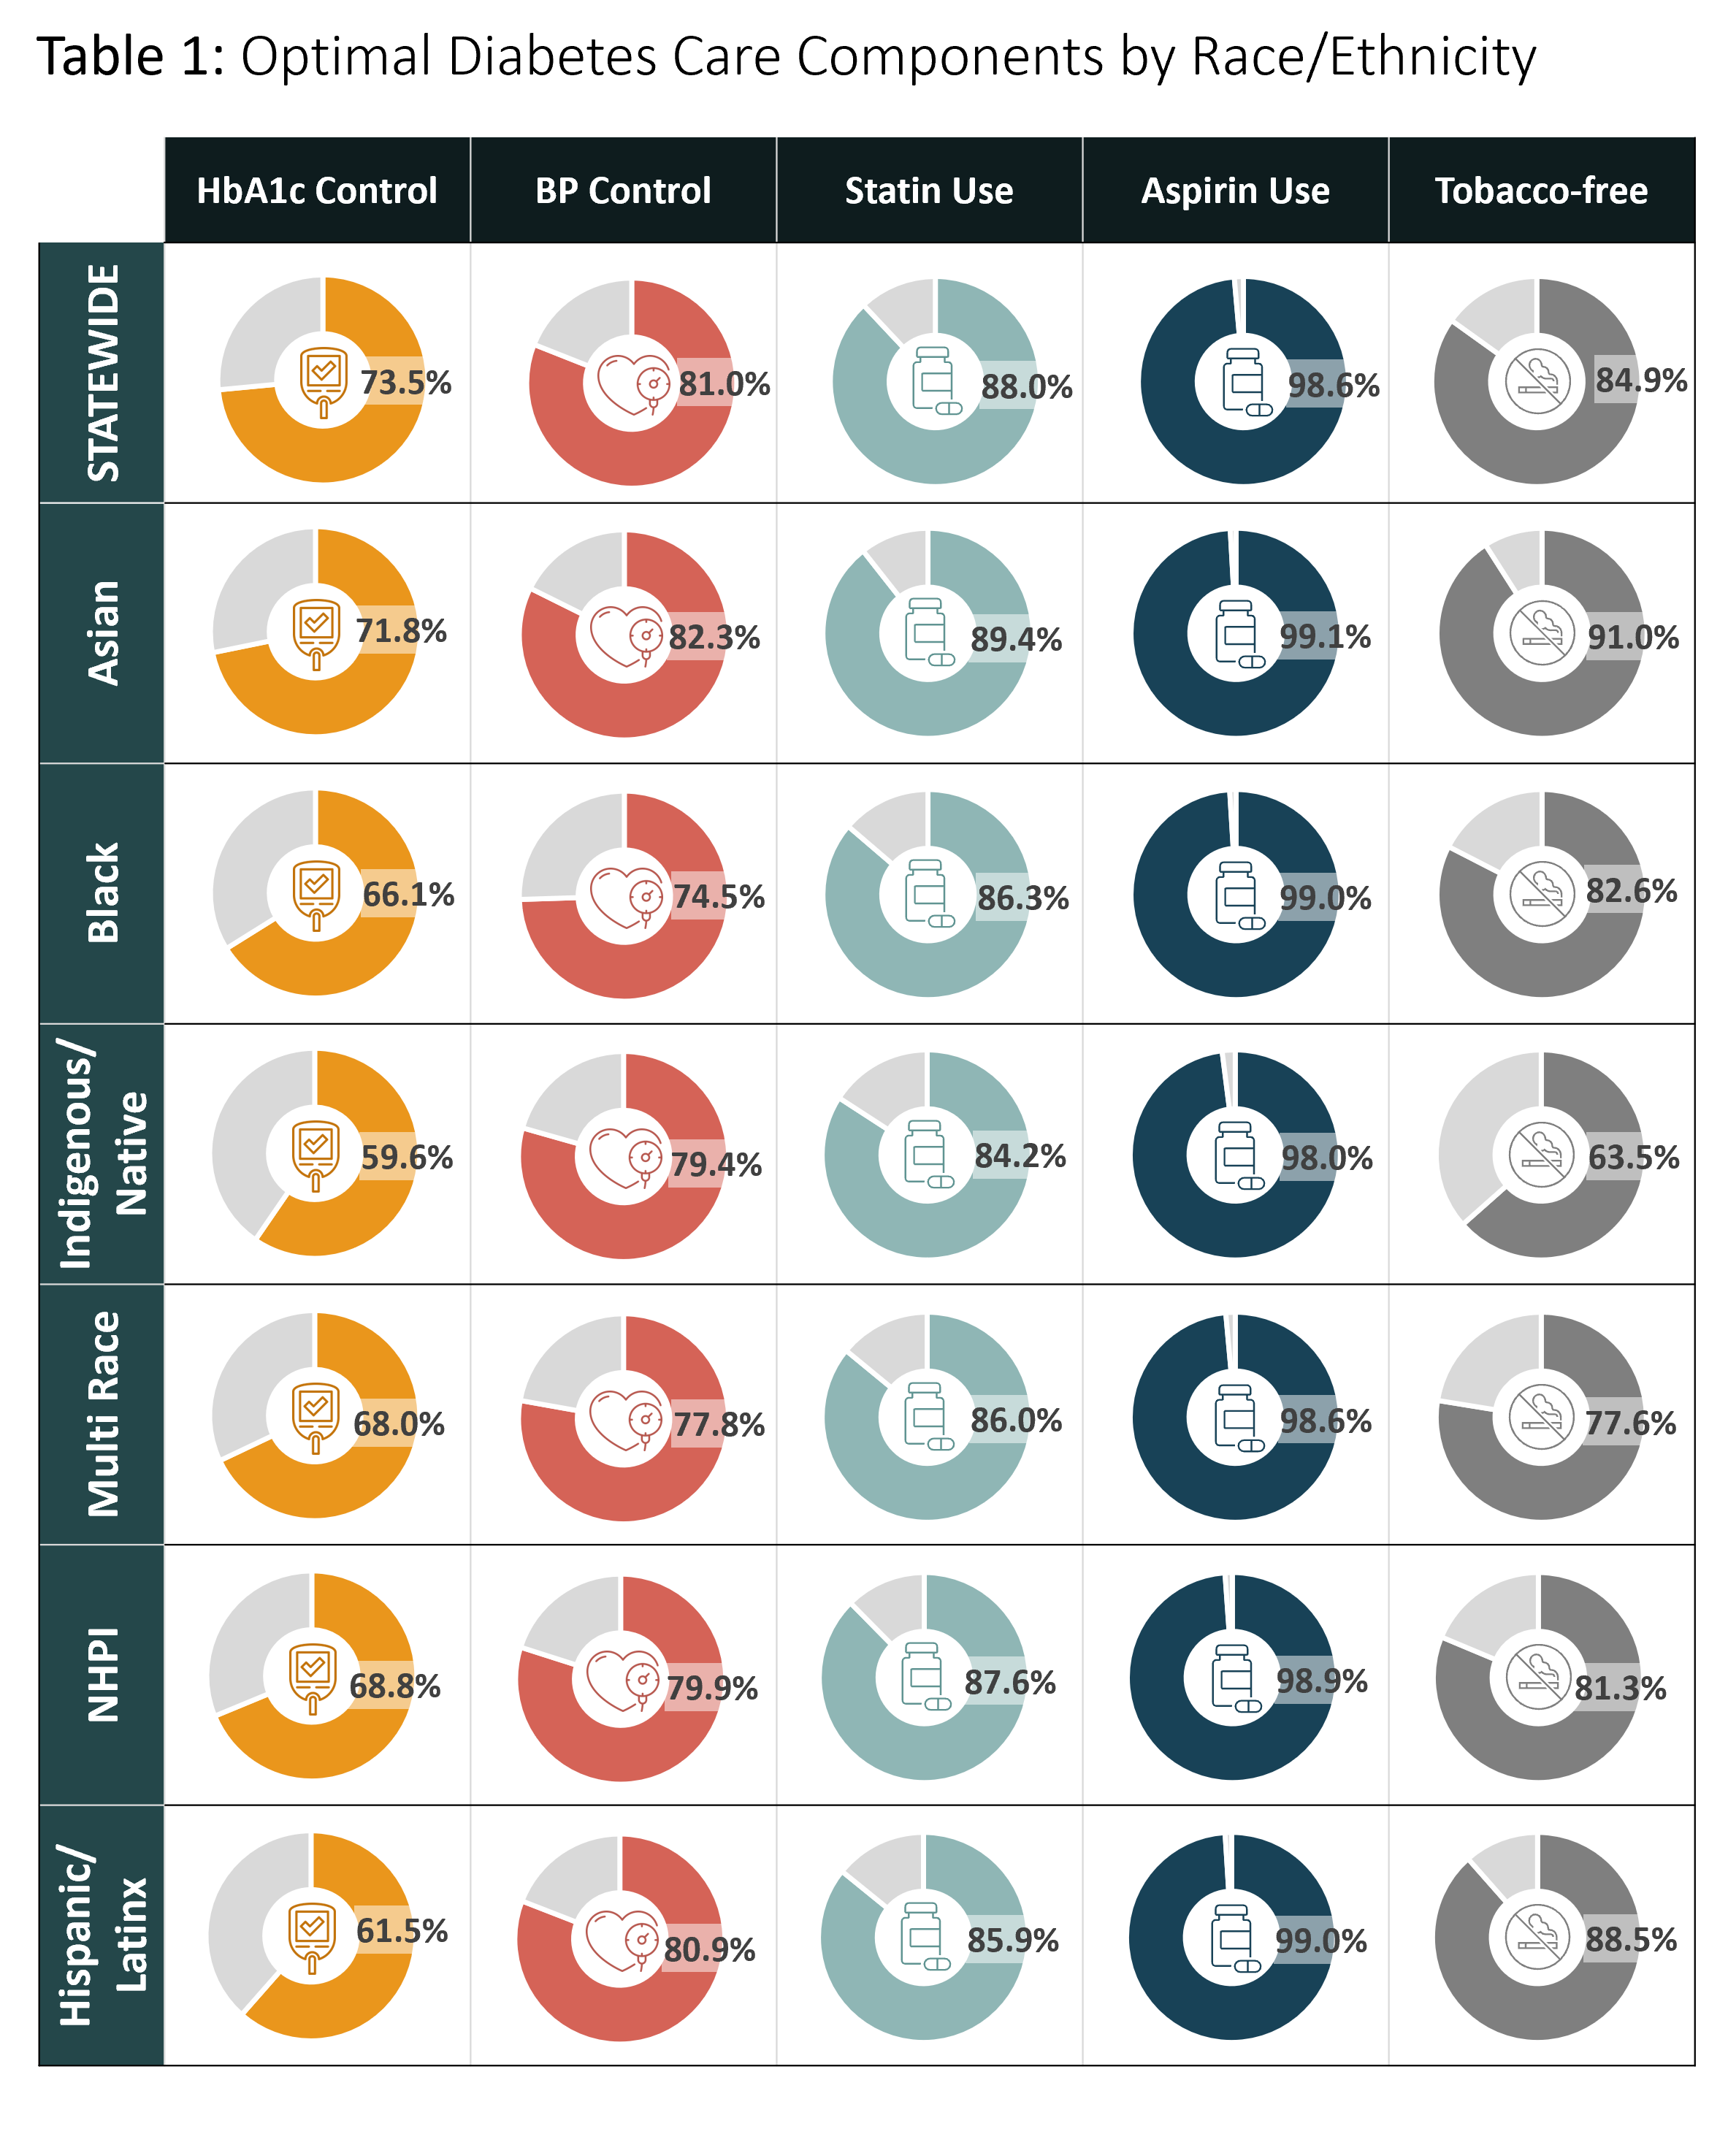
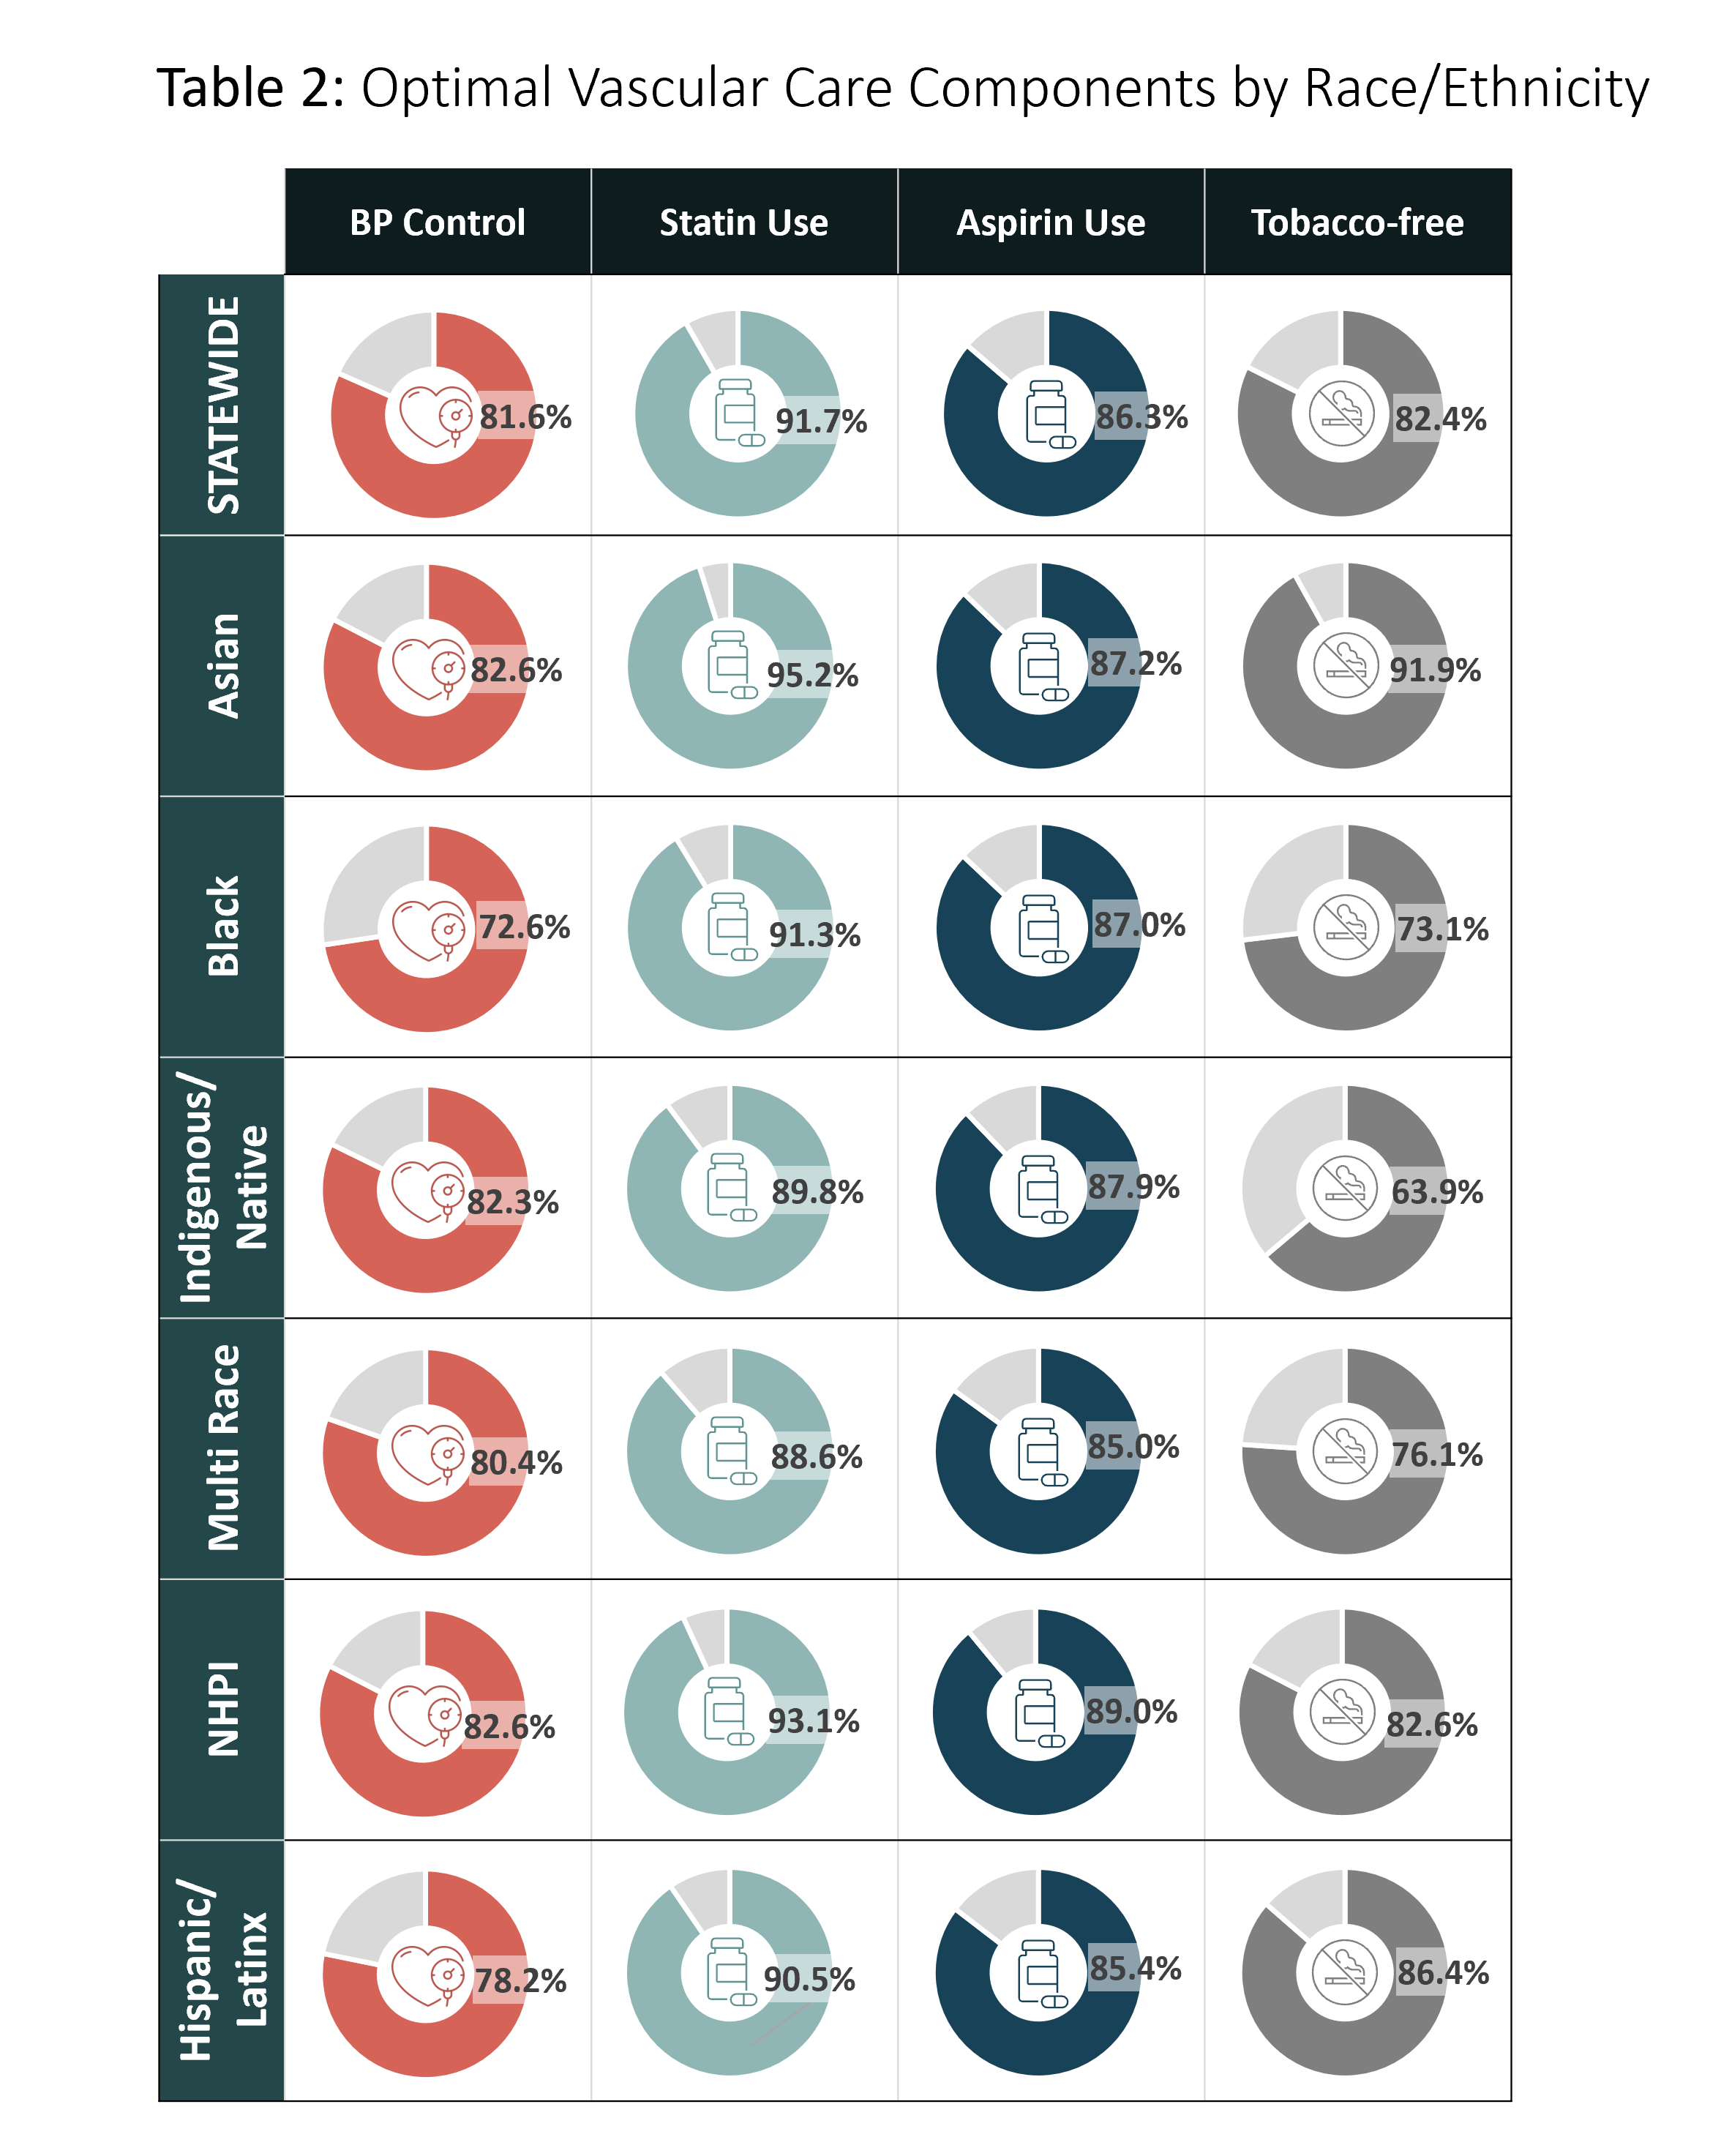
Breaking these measures down further, MNCM also reports on the individual components. Tables 1 and 2 show the component rates stratified by race and ethnicity, showing significant gaps. For instance, all racial groups had lower-than-average percentages of diabetes patients achieving A1c levels below 8%. These insights pinpoint where health initiatives can focus to have the greatest impact on helping patients and providers work together to effectively manage health.
Additional measures stratified by race and ethnicity can be found in our recently released report, Health Care in Minnesota: Summary Report on Quality, Disparities, and Cost, and in MNCM’s Statewide Performance Hub.
Why This Matters
Minnesota’s population is growing and becoming more diverse. According to the U.S. Census, the state’s diversity index rose from 30.3% in 2010 to 40.5% in 20203. As of 2023, Minnesota is home to 5.8 million residents, with people of color making up about 23% of the population. These communities are growing at a faster rate than the White population, and by 2055, it’s projected that over 2.1 million Minnesotans, or 35% of the population will identify as people of color4.
If racial disparities in health care persist, they will only grow alongside our changing population. That’s why this data matters. It helps shape a more equitable health care system by guiding where resources and attention are most needed. By elevating these disparities and working collaboratively, Minnesota can strive toward a future where health equity is achievable.
Are you a provider, health plan, or community organization using MNCM data to drive health equity efforts? We’d love to share your story. Reach out to us at support@mncm.org to share your work.
References: